 Bullish Review Subscriber's
Guide
Bullish Review Subscriber's
Guide
Bullish Review's primary mission is to provide timely in-depth analysis of the Commitment of Traders in Commodity Futures (COT) report published by the Commodity Futures Trading Commission (CFTC). This report has been published since the 1970's but was discontinued in 1982. Due to public pressure, the Commitments were restarted in 1983. I refer to the post-1983 reports as modern data. Pre-1982 data is of little use in our analysis due to two factors: (1) Reporting requirements and collection procedures were substantially changed in 1983; and (2) the NON-COMMERCIAL (Large Speculator or CTA) category is dominated today by commodity funds which were an insignificant factor prior to the 1980s.
Although the CFTC has released new variations, we rely principally on what the CFTC calls "Legacy Reports", namely the Futures + Options and the COT-Supplemental (CIT) reports. The Commitments report breaks down the open interest in major futures markets into 3 categories. Large traders (who hold positions above reporting levels established by the CFTC) are required to report their holdings on a daily basis. (These are different from speculative trading limits established by the CFTC.)
Large trader positions in most cases are actually relayed electronically by their broker. These positions are broken down into Commercial and Non-commercial (Large Speculator) categories. The balance of the open interest is listed as Non reportable positions. This includes both speculators and commercial hedgers whose holdings are below reporting guidelines. We refer to these as Small Traders.
The COT-Supplemental or CIT report further breaks out Commodity Index Traders (CITs) from the Commercial category, but only twelve markets are reported. These include: corn, Chicago and KC wheat, soybeans and bean oil, cotton, coffee, cocoa, sugar #11, feeder cattle, live cattle, and lean hogs. There is much more information about this trader group on my blog: www.CommitmentsOfTraders.ORG .
SAMPLE Commitments of Traders Report
HDR3140100001000107941530 IMM S&P 500 STK INDX     01/04/94
                    REPORTABLE POSITIONS                     :
-------------------------------------------------------------:  NONREPORTABLE
      NON-COMMERCIAL      :   COMMERCIAL   :       TOTAL     :    POSITIONS
--------------------------:----------------:-----------------:----------------
 LONG  :  SHORT :SPREADING: LONG  :  SHORT :  LONG  :  SHORT :  LONG  : SHORT
------------------------------------------------------------------------------
(S&P 500 INDEX X $500.00)                             OPEN INTEREST:   183,638
COMMITMENTS
  5,824   22,228    1,217  136,901  122,906  143,942  146,351   39,696  37,287

CHANGES FROM 12/28/93 (CHANGE IN OPEN INTEREST:  -1,592)
    -26    3,500      350   -3,518   -4,415   -3,194     -565    1,602  -1,027

PERCENT OF OPEN INTEREST FOR EACH CATEGORY OF TRADERS
    3.2     12.1      0.7     74.5     66.9     78.4     79.7     21.6    20.3

NUMBER OF TRADERS IN EACH CATEGORY (TOTAL TRADERS:     165)
     10       24        3       92       77      105      101
CoT Index Calculation
This index converts the net positions to a 0 to 100% bullish scale based on the relationship of the current Commercial net position to historical extremes. The formula is as follows:
| Current Net - Minimum Net | |
| INDEX = 100 X | ----------------------------------------- |
| Maximum Net - Minimum Net | |
| Where: | |
| Current Net = | Commercial Longs - Shorts |
|---|---|
| Minimum Net = | Smallest range between long and short contracts during look-back period |
| Maximum Net = | Largest range between long and short contracts during look-back period |
| Net Position = | Long Contracts MINUS Short Contracts |
Traders familiar with Williams' %R and Lane's %K will recognize the similarity in the COT Index formula. The same algorithm can be used to calculate an Index for the Large Speculator and Small Trader categories.
Please do not ask me for the look-back periods. These are proprietary (about the only secret I have). And you do not need to know the look-back because I provide my COT Indexes in comma-delimited file format at www.CommitmentsOfTraders.ORG The only other source for my COT Indexes is CSI Data, where you can purchase these as a part of a price data package.
Accurate Data?
The CFTC currently tabulates net positions each Tuesday and posts them to their website here each Friday at 3:30 Eastern time (unless the holiday intervenes). You can view the current release schedule here .
The Commitments report was, until November 1990, issued on a monthly basis about two weeks after the end of the month. It had been largely ignored by individual futures traders due to the perceived untimeliness of the statistics. Thanks primarily to a letter writing campaign by our subscribers, the CFTC began twice a month reporting in 1990. Indexes for the period Nov 1990 to Oct 1992 are based on positions as of the 15th and the last trading day of each month. At the time of this change, the CFTC released bimonthly historical figures for the period of 1986 - 1990. These have been picked up and resold by some opportunistic vendors. What they do not tell you is that the historical data is unaudited and the CFTC acknowledges that it is unreliable with the following warning:
"Please be advised that prior to September 30, 1992 only mid-month and month-end data are available. Since the mid-month data were not published on a current basis, they may contain identifiable data errors. A substantial period of time elapsed between the report date for these data and their eventual compilation. As a result it is not possible to correct the errors." .
Our data base extends back to the beginning of the modern data, January, 1983. It took us 1-1/2 years to obtain the entire series from original reports. The CFTC does not even maintain data back that far. We painstakingly assembled and error-checked this data and believe it to be the most reliable and extensive data base in existence. Beginning in November 1991, the CFTC moved to weekly tabulation and biweekly release, and in 2002, the current weekly Friday release schedule.
For those who wish to incorporate the COT Index or net positions into their own charts, this data is freely available at www.CommitmentsOfTraders.ORG
Bullish Review First Look Format
First Look is published on Saturdays for the convenience of traders who use the weekend for market analysis. This is an adjunct to Bullish Review and is not available separately. I reserve the right to change my mind after performing detailed analysis for Monday's Bullish Review.
The first 2 pages of First Look are based on sector composite net positions, where trader positions from several markets within a complex are combined. For instance, soybeans, soy meal, and soy oil trader positions are combined for the Soy Complex chart. For the Dollar Index, I combine trader positions for several Chicago IMM foreign currency futures. These net positions are then inverted to provide a dollar-basis indicator. We have found this very useful, since the NY Dollar Index has historically traded at a relatively low open interest. These COT readings will not agree with the page 3 table (page 4 in Bullish Review), which are for individual markets.
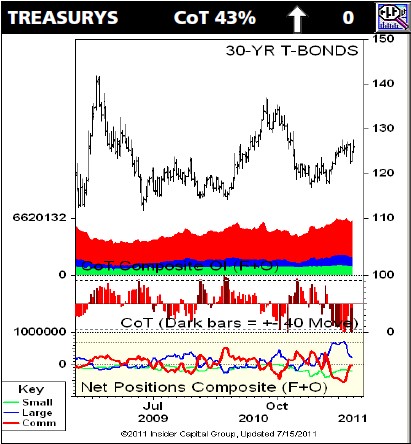
The title line lists the market sector (in this case Long Term Treasurys), the current COT Index (43%), an arrow showing whether the COT is up or down from the previous week, and the week-over-week change in the COT Index (0 percentage points). In this case there was no change from the prior week, but the up arrow indicates that the previous week was an up week. NOTE: We can only print one price chart, so we select a representative chart from the sector.
The chart displays:
Weekly price bars based on continuous (non-adjusted) nearest contract. Commercials are price sensitive, so we want to know what the actual historical front-month contract price was at each data point.
Stacked open interet. This is the non-spreading open interest from the COT report. Red=Commercial; Blue=CTA, Green=Non-reporting small trader.
COT Index as a 0 to 100% histogram. Dark bars indicate minor COT buy signals (+ - 40 COT points within a 6-week period.
Net positions. Longs minus shorts for each reported trader group.
COT SIGNALS
Page 3 of First Look is identical to Page 4 of Bullish Review. This lists a COT Index for EACH trader group, along with the change from the previous week. The date shown is the actual tabulation date (normally Tuesday, preceding Friday's release).
On the left, next to the market name you may find the following symbols.
>> COT Extreme Level - the COT Index has reached either the Major Buy Signal threshold (90% COT or above) or the Major Sell signal level (5% COT or below)
> COT Extreme Movement, either a Minor Buy Signal (COT rose 40+ points within the last 6 weeks) or a Minor COT Sell Signal (COT declined 40 or more points within the last six weeks) was triggred.
These symbols tell you whether commercials are buying or selling, but they do not tell you what this means--this is the purpose of the commentary. It is a common occurrence for the commentary to be bullish, with the COT Index apparently bearish, and visa-versa. This table is for reference, but unless you are highly experienced in COT analysis, better to ignore the table.
There is another type of COT buy / sell signal not shown on this table. It is the COT-Fisher signal, which is based on movement in trade net positions, but is not confined to a +-40 point rule-of-thumb. The construction is a bit complex and is part of our 2008 COT Master Trader seminar cd (to be released in 2012), but this signal is quite good at spotting short-term trend changes. We also refer to a COT-Fisher signal warning. These progress to an actual COT-Fisher signal in 95% of cases, and warnings are often more timely than the signal itself.
The COT-Fisher uses a Fisher Transform to amplify movement of the COT, generating signals the otherwise would not be seen. The Fisher Transform was published by R.A. Fisher in 1915. Look to the web for detailed information. You might start at this informative article: http://en.wikipedia.org/wiki/Fisher_transformation
![]()
Pages 4 to 9 contain current weekly charts for most of the reported markets. Larger charts are available (along CIT charts) at www.CommitmentsOfTraders.ORG.
Bullish Review Format
This is usually a 4 page letter, more or less as the COT Report dictates. The markets selected for each issue are determined by developments within Commitments report, although I try to rotate coverage to include all most active markets on a regular basis.
The first 3 pages of market commentary are the heart of this report. After 40 years of doing this, I find COT analysis to be as much art as science. Charts and listings of COT Indexes and indicators are provided for reference, but most traders will want to concentrate on reading my commentary over referring to charts and tables. I try to make this both informative and educational. For those determined to make their own analysis, I invite you to buy my book, The Commitments of Traders Bible, by clicking here .

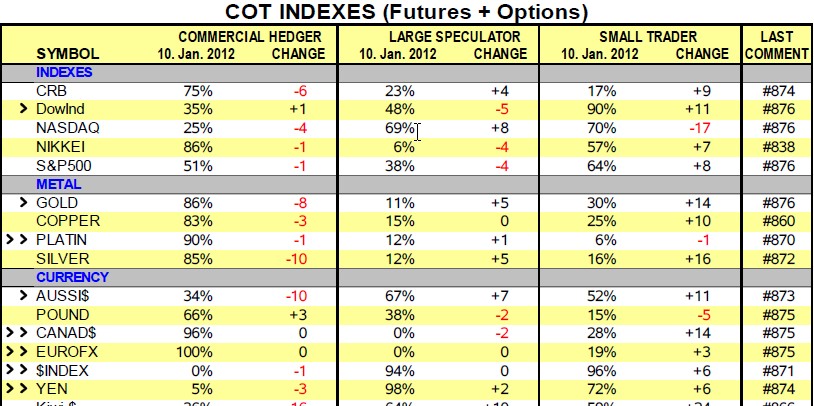
The last page of each Bullish Review displays a tabular listing of the COT Indexes by trader group. Two indexes are reported for each group. These are based on positions from the past Tuesday. The date of the actual position tabulation is shown at the top of the respective column. Our primary interest is in the Commercial figures shown on the left.
The Movement Index is simply the number of points the COT Index has moved since last week. A plus [+] or minus [-] next to the market name indicates a market where the Commercial COT Index has moved + or - 40 points within the past 6 weeks. We call this a minor signal. A double sign [++ or --] indicates a Commercial COT Index above 90% or below 5% respectively. We call this a major COT signal.
The right hand column ("Last Comment") lists the most recent issue number in which we analyzed the respective market in the "Commentary" section which is 1 to 3 pages long (depending on market situations). Page 3 is provided for reference, but you should concentrate on the commentary pages. COT signals must be viewed in context of price level and trend. Just because you see a ++ in no way suggests a buying opportunity. My job is to provide context.
Unless otherwise noted, all charts in Bullish Review are weekly continuous nearest contract. The COT data is also weekly, unless otherwise noted.
Charts come in various combinations of the following indicators::

1. Price bar , which includes weekly open (left tick) high, low, and Friday close (right tick)
2. Non-spreading open interest from the Commitments report. This is a stacked area chart showing the relative open interest of the three trader groups, red = commercial blue = CTA green = non-reporting (small trader). Trend changes tend to occur at peaks in this indicator.
3. COT-Fisher Indicator. This indicator generates buy (blue) and sell (red) signals, which are displayed as spikes away from the zero line. This signals are based on commercial buying or selling momentum, not on the absolute level of their net position. When the indication agrees with the major trend (buy signal in an uptrend or sell signal in a downtrend), a trend continuation is indicated. When the indication is counter to the major trend (buy signal in a downtrend or sell signal in an uptrend), a temporary trend correction often occurs.
4. COT Movement Index. These bars show the maximum difference in the current COT Index reading from the previous six weekly readings. Black bars indicate a + or = 40 point movement within a six-week period. This is another momentum-type indicator. A +40 point Movement often indicates the end of bull market correction and signals the next upleg is imminent. A -40 point Movement during a correction in a downtrend often signals the beginning of the next downleg. A failure of either of these to restart the respective trend is a strong indication that the primary trend may be changing.
5. Cycle Indicators: Unlike the other sub-panes, this indicator is price-based (not COT). It is intended to aid trend identification. Three cycles are tracked Green = long-term (approx 4 year); Blue = intermedate-term (2-year); Red = short-term trading cycle (approx 9 months). The cycle is in up phase when above the upper dashed line, and in a down phase when below the lower dotted line. Readings registering between the dotted lines are non-determinate.
6. Net Positions: This is the primary COT Indicator, calculated by subtracting short contracts from long contracts for each trader group. An above-zero reading indicates more long than short contracts (net long position); a below-zero reading indicates more short than long contracts are held (net short position). Being net short or net long is, bit itself indicative. We compare the current net position to its historical range to determine whether a reading is bullish or bearish. (see COT Index next). Line colors: red = commercial blue = CTA green = non-reporting (small trader).
CIT Net Position: For markets included on the COT-Supplemental report, a fourth net position for Commodity Index Traders (CIT) is shown in black. In this case, the commercial total is net of the CIT.
7. COT Index: This histogram, centered on 50%, shows the relative bullishness of commercial traders on a 0 to 100% scale. (See COT Index Calculation above.) Like oscillators, this Index must be interpreted within the framework of price level and trend. The typical bear market pattern is for the COT Index to remain "pegged" near 100%; the typical bull market pattern sees the COT Index "pegged" near zero. You begin to see the necessity of reading the related market commentary before jumping to conclusions based on the COT Index level.
Crowd Psychology
Every year one or more futures markets makes an extreme price run--usually both up and down. Prices may rise dramatically for days on end until prices are far above or below rational pricing. This is crowd psychology at work. Crowd theory is a critical element in futures trading. As soon as you take a trading position you become part of a crowd -- ready or not. Traders' opinions become colored by the thoughts of the crowd. Conveniently commodity crowds tend to form along lines similar to the trader breakdown provided by the CFTC.
Commercial Hedgers are members of one of two crowds: producers or consumers. They trade on inside information and generally only in one direction. Producers (mining companies, mutual funds, grain elevators) hold a cash position in the commodity and sell forward in the futures market when they expect a price decline. Consumer commercials (food producers, manufacturers, refiners) have a future requirement for the respective underlying product and buy forward in the futures markets to cover those needs. These two crowds use the futures markets to reduce risk. Besides a similar goal, these traders share an edge in fundamental supply and demand information and have the deep pockets, offsetting cash position, and long term outlook necessary to trade on fundamentals.
Large Speculators are willing to assume risk from commercials in the exchange for profit opportunity. Some trading books written in the 1970s recommended trading with this crowd because they typically became large traders on the strength of their trading ability. Today this category is dominated by CTAs who prosper in large part on their sales ability. Besides a shared competitive profit incentive, this crowd is dominated by computer-driven trend-following approaches that respond similarly to price movements. When one goes off a cliff, the others follow like lemmings. Our job is to alert you to cliffs as they arise.
The remaining non-reporting traders include both speculators and small commercial hedgers. These Small Traders, by definition, have smaller pocket books than the other two crowds. Lacking inside information, this crowd is more susceptible to news, hopes and whims. Members of this crowd are likely to be bullish if long rather than long because they are bullish. An interesting characteristic of crowd psychology is that most members relegate decisions to the crowd and crowds often make decisions that their individual members would find illogical if separated from the crowd.
Futures prices react to buying and selling pressure generated by the above crowds. The crowd mentality causes price trends to move to extremes. It is those extremes that we hope to spot using Commitments analysis.
Open Interest Analysis
The Commitments of Traders report provides the only factual breakdown of open interest available. In other words you do not need to rely on pit rumors like "Saloman is selling bonds" or "Continental was a major buyer in beans today" to know what crowd you are trading with or against. Open Interest analysis is used to quantify crowd psychology in futures markets. Open Interest is defined as the total number of outstanding contracts in a futures market. Each contract is held by two traders, one long and one short. Trading textbooks have proffered certain maxims of open interest and volume (number of contracts changing hands over a specified period) analysis. These are usually stated as:
| PRICE | VOLUME | O.I. | MARKET |
|---|---|---|---|
|
Rising |
Up |
Up |
Strong |
|
Rising |
Down |
Down |
Weak |
|
Declining |
Up |
Up |
Weak |
|
Declining |
Down |
Down |
Strong |
These rules are often repeated, widely accepted, and work--about 1/2 the time. Bullish Review attempts to determine when the open interest rules are likely to work and when they are likely to fail. First, we need to throw some cold water on the subject. Namely, from our perspective, volume is useless as a price predictor. Volume falls into the class of coincident indicators. That is, it holds no predictive value.
Volume Is Coincident To Volatility. On this T-Bond chart the
5 day average volume is graphed on the lower histogram. The 5 day average
daily range (volatility) is inverted on the upper histogram. Notice the
mirror image, as volatility grows, volume rises and as volatility subsides,
volume declines.
Open interest analysis, on the other had can provide some meaningful predictive value. First a splash of cold water. In addition to those listed above, another oft repeated rule states that an open interest increase during a consolidation is bearish because commercial hedgers are adding to their shorts.
Open interest rise during consolidation turns out to be Commercial buying: During the December's tight trading range open interest increased 27%. Textbook analysts viewed this as bearish. But reviewing the Net Trader Position chart you could see that Commercials were buying -- a bullish sign. When Rising OI during a rally is bearish: Open interest rose 35% during the strong February and March price rally. Textbook analysts saw this as a confirmation of the uptrend. Commitments analysts noted that Commercials were adding shorts on the rise and prepared for a correction.
The point is: why guess who's buying and who's selling when the CFTC is kind enough to provide a factual accounting every two weeks? We use open interest analysis between Commitments releases to alert us to a potential change in net positions. A change in open interest of 10% or more is enough to sound the alarm. There is no method available to determine the actual effect until the next report. Guessing has not proved any more reliable than the textbook methods sited. A substantial open interest change alerts the analyst that something in the mix of buyers and sellers may have changed. Some increased caution is warranted with any open positions for the few days until the next report.
Since it takes an additional long plus and added short player to create an increase in open interest, an increase tells us that crowds are expanding on both sides of the market. Expect higher volatility (and volume). Expect just the opposite from a decline in open interest.
For our purposes, we look at non-spreading open interest tallied from the COT report. Major market turns tend to occur at peaks in this open interest.
C.O.T. Index Signals
The COT Index aids open interest and Commitments analysis by converting the raw net positions to a standard scale. Due to differing mixes of traders, raw net position charts cannot be compared between markets. The patterns can be completely different yet provide a similar forecast. We use the COT Index first to select among three dozen markets, those which appear to merit further analysis. Within a selected market, we use the Index to highlight prior similar patterns.
We have found there are two circumstances that signal special interest. We refer to these as COT buy and sell signals but you should not take this as a recommendation to buy or sell. We use these terms only to provide a clear indication of Commercial activity. You must employ your own system or methods to produce actual trade entry and exit points. We are looking for intermediate to major market turning points. These are special situations that may not be apparent from any other analysis but may take some time to develop. However, you cannot rely on the Commitments data to predict each major turn. This type of analysis is useful to both long and short term traders but your use of the information will be unique to your own situation.
First, we look for markets that are near the scale extremes. Below 5% for a sell signal and above 90% for a buy signal. We refer to these as major signals. Secondly, any market that experiences a move in the COT Index of + or - 40 points within the last 6 weeks generates a minor signal. A plus 40 movement is a buy and a minus 40 movement is a sell signal. The major and minor designations do not signify the degree of expected trend change nor the potential for the next move. Major just means that trading crowds are at historic extreme levels, differentiating from the minor signals which indicate a meaningful change in net trader positions. Either signal can be equally significant. When one of these signals are generated we expect a trend change. This can be from up or down to sideways or from sideways to up or down. The signal may also highlight a full trend reversal situation. Again, while these signals frequently highlight important trend changes when they occur, you cannot rely on Commitments data to warn you of every trend reversal. That would make it too easy.
SIGNAL FAILURES
In his book A Complete Guide To The Futures Markets, Jack Schwager highlights the most important rule of chart analysis:
"A failed signal is among the most reliable of all chart signals. When a market fails to follow through in the direction of a chart signal, it very strongly suggests the possibility of a significant move in the opposite direction.
. . .
"A novice trader will ignore a failed signal, riding his position into a large loss while hoping for the best. The more experienced trader, having learned the importance of money management, will exit quickly once it is apparent that he has made a bad trade. However, the truly skilled trader will be able to do a 180-degree turn, reversing his position at a loss if market behavior points to such a course of action."
C.O.T. signals should be treated similarly. We pay particular attention to the price level at which extreme COT readings are generated. Commercial hedgers will often defend the same price level each time it is touched for extended periods of time. Since Commitments figures are tabulated at each Tuesday's close, we can often identify exact price levels of Commercial operations. When prices break through a price level that Commercials have defended repeatedly, a signal failure is apparent. This type of move, by definition, is speculative driven and can be highly explosive (and profitable if properly played).
FUNDAMENTALS
I have received countless phone calls over the years, inquiring how Commercial traders could be selling (or buying) at a time when they were "obviously" trading against the fundamentals. That always reminds me of a comparison between statistics and bikinis. Both reveal much that is interesting but conceal everything that is critical. Some technicians believe that market fundamentals are already factored into the market price--therefore not worth study. I am not of that school. However, the same Commercial houses we are trading against just happen to be the primary source of fundamental news, forecasts and analysis. In the best case, by the time we hear the news Commercials have already acted on it. In the worst case, the news as disseminated is not factual or complete.
Other sources of fundamental information sources include government reports that are notoriously inaccurate and the financial pages. Newspapers writers in general don't stick out their necks, are not well informed and don't like to look foolish. Therefore, once a trend is well established (or more likely nearly complete) they drag up every fact or rumor in the files that support what has already occurred. Moral: check your source.
There is no question that Commercials trade on inside information. It may be perfectly legal but it gives them an undeniable edge. We use the Commitments data to decipher true fundamentals by watching what Commercials do in the market (rather than what they say to the press). We have found repeatedly and regularly that Commercials accumulate (or distribute) positions and markets move well before the fundamental explanation is apparent. We use the COT Indexes as our primary source of fundamental information.
SYMBOLS
Note: Your will find symbols used for COT data files with the data at www.CommitmentsOfTraders.ORG
| CRB | Continuous Commodity Index |
| DowInd | Dow 30 Industrials |
| NASDAQ | NASDAQ 100 |
| NIKKEI | NIKKEI 225 |
| S&P 500 | S&P 500 |
| GOLD | GOLD |
| COPPER | COPPER |
| PLATIN | PLATINUM |
| SILVER | SILVER |
| AUSSI$ | AUSTRALIAN DOLLAR |
| POUND | BRITISH POUND |
| CANAD$ | CANADIAN DOLLAR |
| EUROFX | EURO (CURRENCY) |
| $INDEX | US DOLLAR INDEX |
| YEN | JAPANESE YEN |
| Kiwi$ | NEW ZEALAND DOLLAR |
| PESO | MEXICAN PESO |
| SWISS | SWISS FRANC |
| 3MO-ED | 3 MONTH EURODOLLARS |
| 5YR-TN | 5 YEAR T-NOTE |
| 2YR-TN | 2 YEAR T-NOTE |
| 10Y-TN | 10 YEAR T-NOTE |
| 30Y-TB | 30 YEAR T-BOND |
| SB-OIL | SOYBEAN OIL |
| CORN | CORN |
| KC-WHT | KANSAS CITY WHEAT |
| MN-WHT | MINNEAPOLIS WHEAT |
| OATS | OATS |
| RRICE | ROUGH RICE |
| SBeans | SOYBEANS |
| S-MEAL | SOYBEAN MEAL |
| WHEAT | CHICAGO WHEAT |
| CATTLE | LIVE CATTLE |
| HOGS | LEAN HOGS |
| COCOA | COCOA |
| COTTON | COTTON |
| COFFEE | COFFEE |
| LUMBER | LUMBER |
| OJ | ORANGE JUICE |
| SUGAR | SUGAR #11 |
| CRUDE | CRUDE OIL |
| H-OIL | HEATING OIL #2 |
| NATGAS | NATURAL GAS |
|
Gasoli |
RBOB GASOLINE |